Multiscale Carbon Burden of Infrastructure in the United States

WCTR, Toulouse, France

Jason Hawkins, PhD PEng

2026-07-13

Overview

  • Study land use & climate mitigation relationship by combining Vulcan 1-km gridded fossil fuel CO2 (FFCO2) & EPA Smart Location Database land use features
  • Partition emissions into transportation, residential energy, & scope 2 residential electricity
  • Perform doubly robust inference using continuous propensity scores & BART outcome regression

Motivation

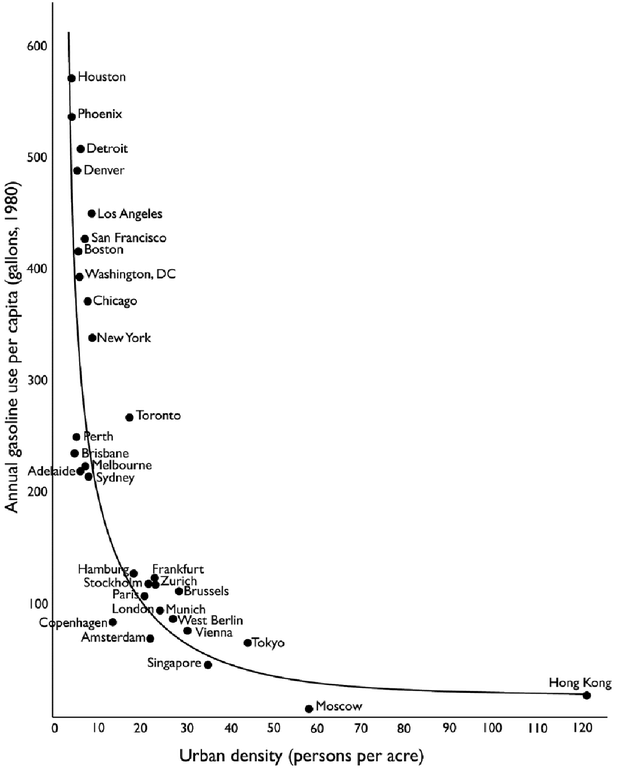
Newman & Kenworthy (1989)

Literature

  • Urban economics: Glaeser & Kahn (2008) used an ad-hoc CO2 estimation strategy to compare 66 metropolitan areas​
    • Lowest CO2 rates in California​
    • Highest CO2 rates in Texas & Oklahoma​
    • Development restrictions push new development into high CO2 regions​
  • Urban planning: Kockelman (1997) + Cervero & Ewing (2010) examine 3/5Ds of land use​
    • Density, Diversity, Design, Destination Access, & Distance to Transit​
  • Urban science: Fragkias et al. (2013) used earlier version of Vulcan CO2 dataset (1999-2008) to study urban scaling in total CO2​
    • Found proportional scaling of 0.95% increased CO2 per 1% increase in population – i.e., larger cities not significantly more efficient

Model Development Process

flowchart LR
  classDef big font-size:36px,fill:#9CD97A,stroke:#11AB67,color:#000000;

  A["Input<br/>FFCO2 by<br/>sector"] --> 
  B["Add climate<br/>and 5D land<br/>use data"] -->

  C["Correlation<br/>analysis to<br/>identify<br/>redundant<br/>variables<br/>for GPS"] -->

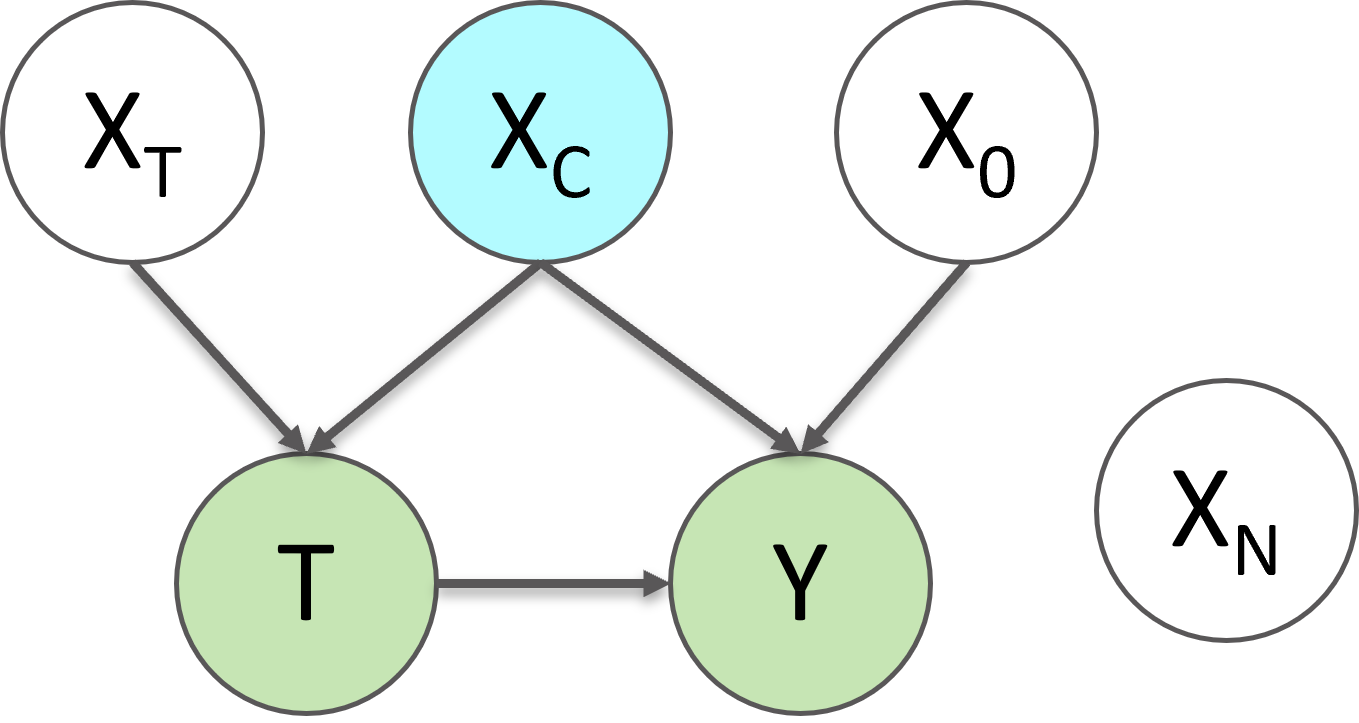
  D["Confounder<br/>analysis<br/>DAGs using<br/>Strata‑sum<br/>importance"] -->

  E["Test GPS<br/>functions<br/>GLM, BART,<br/>etc."] -->

  F["Doubly<br/>robust<br/>outcome<br/>model<br/>BART"] -->

  G["Outcome<br/>models<br/>for 5D<br/>treatments<br/>linear<br/>regression"]

  class A,B,C,D,E,F,G big;

Confounder Identification

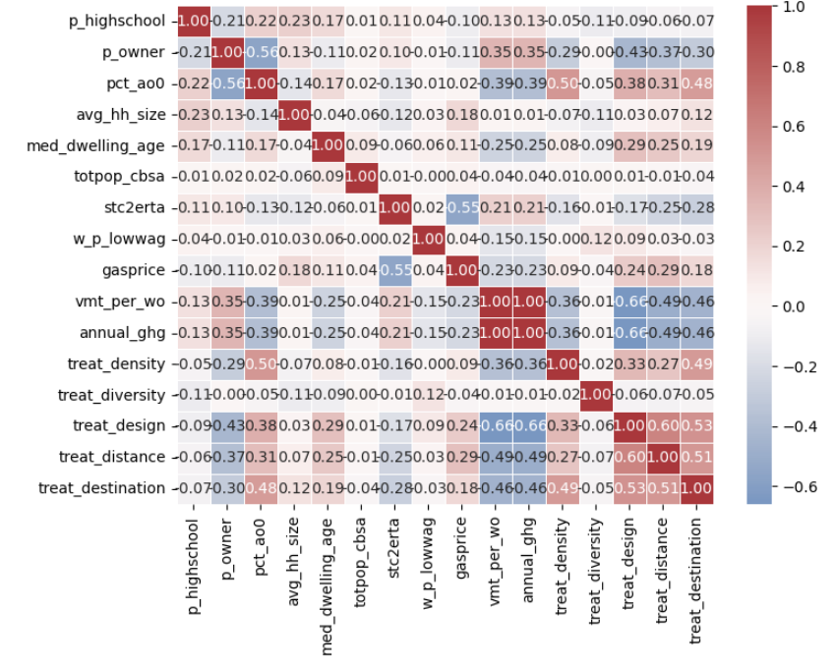
Transportation Pearson Correlation Matrix

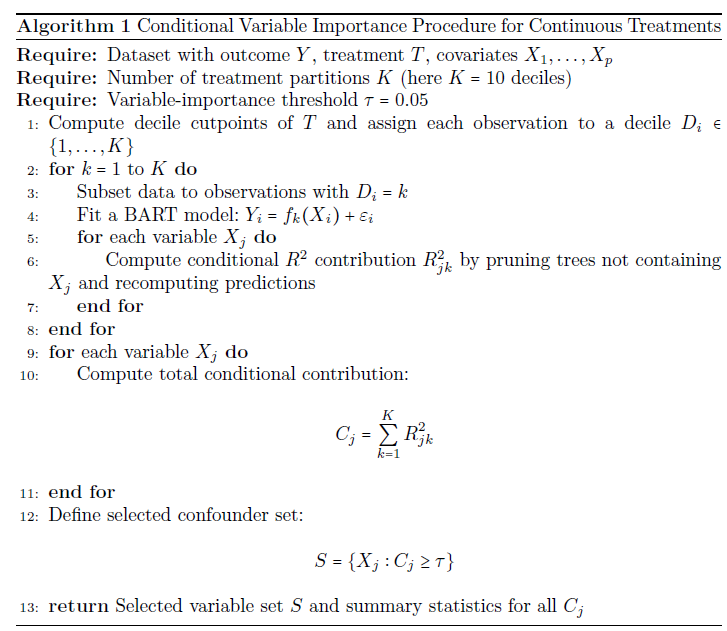
Conditional Variable Importance

Doubly Robust Outcome Model

BART Outcome Model

\[\begin{split} \ln(CO_2 \text{ per capita}) =& \text{ln(total CBSA population)} \\&+ \text{ln(CBSA population density)} \\&+ \text{ln(average CBG treatment level in CBSA)} \\&+ \text{propensity score} \\&+ \text{CBSA fixed effect} \end{split}\]

Doubly Robust Adjustment using BART & Continuous GPS

\[\hat{\mu}_{i}^{DR}(t) = m(t,X_i) + w_i(t)\left\{Y_i - m(T_i,X_i)\right\}\]

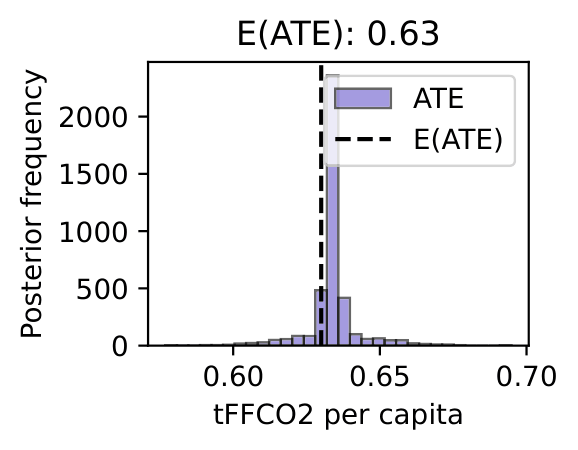
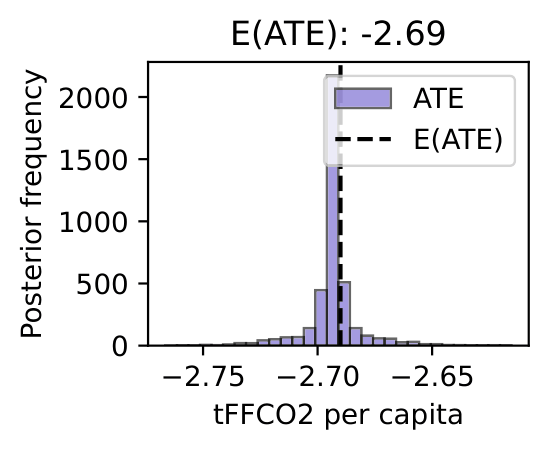
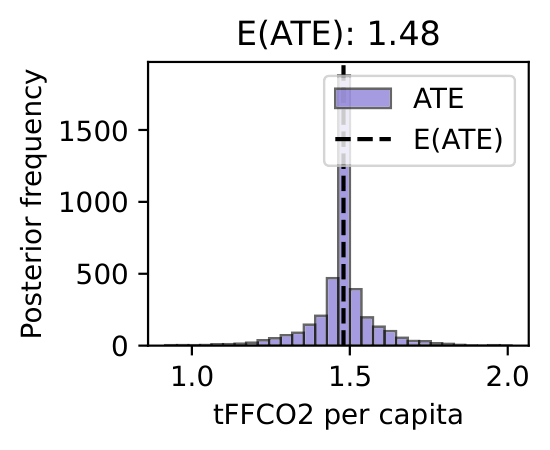
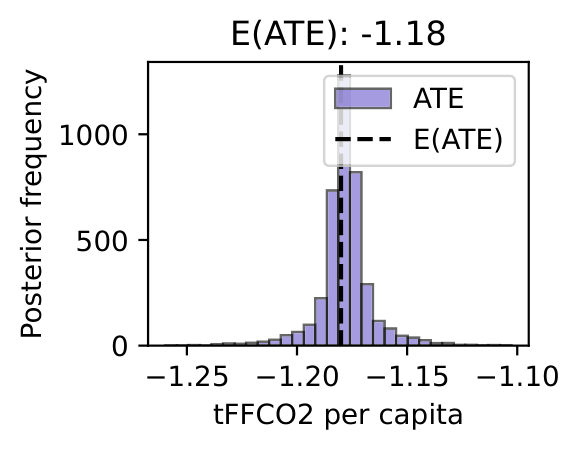
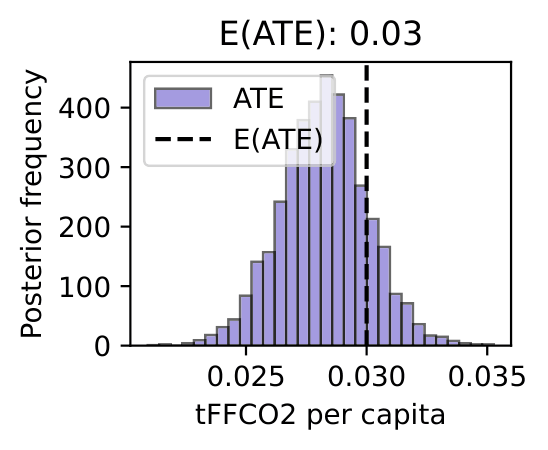
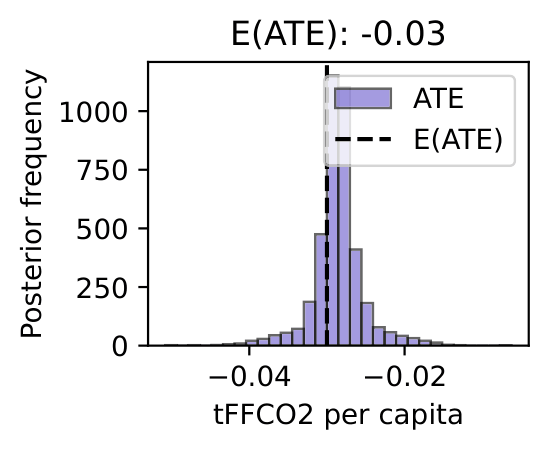
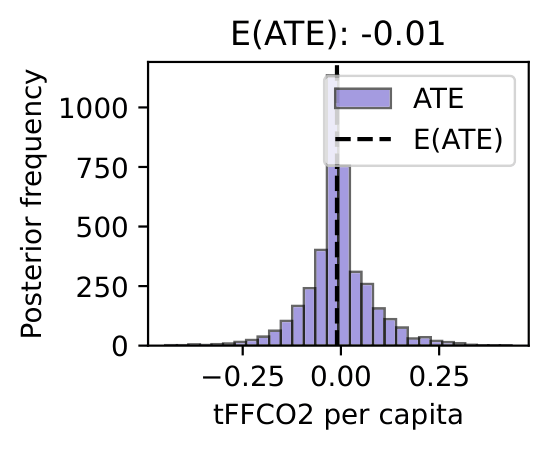
Individual Transportation Results

  • Note: results are production-based, meaning allocated to the point of emissions not trip origin
Density
Diversity
Design
Distance
Destination

Joint Transportation Results

  • Various joint treatment models estimated with metro/local treatments, propensity score adjustment, & spatial parameters
Variable Base OLS Spatial EV SEM + SLX(10km)
Local density -0.187*** -0.187*** -0.194***
Roadway design -0.449*** -0.449*** -0.475***
Transit distance -0.001 -0.001 +0.067***
W Transit distance -0.144***
Residual Moran’s I 0.370 0.368 0.174

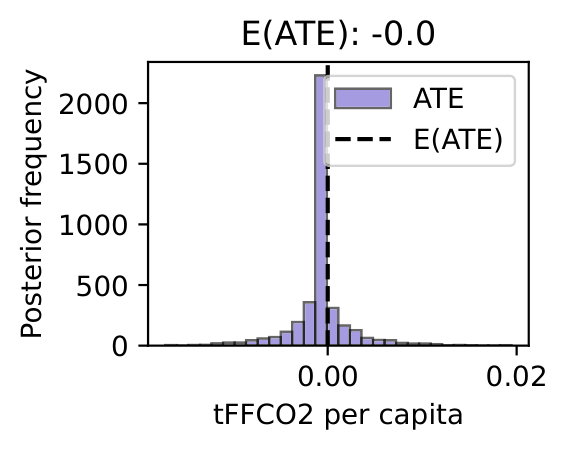
Individual Residential Electricity Results
Density

Diversity

Joint Residential Electricity Results

  • Various joint treatment models estimated with metro/local treatments, propensity score adjustment, & spatial parameters
Variable Base OLS Spatial EV
Local density -0.068*** -0.068***
Local diversity +0.037*** +0.037***
Local diversity \(\times\) PS -0.035*** -0.035***
Residual Moran’s I 0.648 0.648

Individual Residential Energy Results
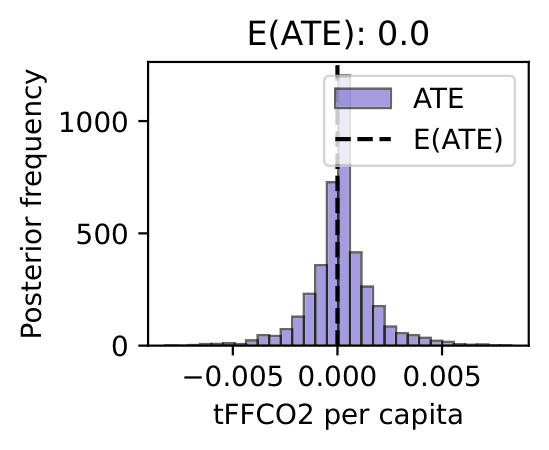
Density

Diversity

Joint Residential Energy Results

  • Various joint treatment models estimated with metro/local treatments, propensity score adjustment, & spatial parameters
Variable Base OLS Spatial EV
Local density -0.120*** -0.120***
Local diversity +0.008*** +0.008***
Local diversity \(\times\) PS +0.010*** +0.010***
Residual Moran’s I 0.431 0.431

Overall Results

  • Production- and consumption-based emissions allocations tell fundamentally different stories: for production-based transportatation FFCO2, higher density lowers emissions but higher land use mix/destination access raises them
  • Residential emissions results are mixed: density lowers both sources but other results vary
  • Roadway network density has a consistently negative effect on transportation FFCO2 emissions

Discussion

  • Congestion pricing/low-emission zones address external cost on local results from production-based transportation emissions
  • Compact development reduces residential emissions
  • Regional 5D averages have minimal effects on sector-specific emissions after controlling for local 5D effects

Future work

  • Develop consumption(home)-based transportation emissions estimates based on OD flows
  • Extension to other criteria air pollutants
  • Spatial scaling analysis by city & climatic zone for population & 5D metrics

Thank you

Questions? Reach out any time.

jfhawkin@ucalgary.ca

Presentation & paper available:

https://hawkins-tech-lab.github.io/